index
R Liniengrafiken
# Befinden, T-Werte (Interventions-, Kontrollgruppe, t=Messzeitpunkte)
b.t <- c(38, 27, 34, 37, 50, 55, 57, 54, 60)
b.w <- c(40, 38, 41, 40, 37, 32, 33, 35, 33)
t   <- c( 1,  2,  3,  7, 11, 15, 19, 50, 90)

# Punktwolke gegen Wert-Nummer
plot(b.t)

# eine Linie
plot(b.t, type='l')
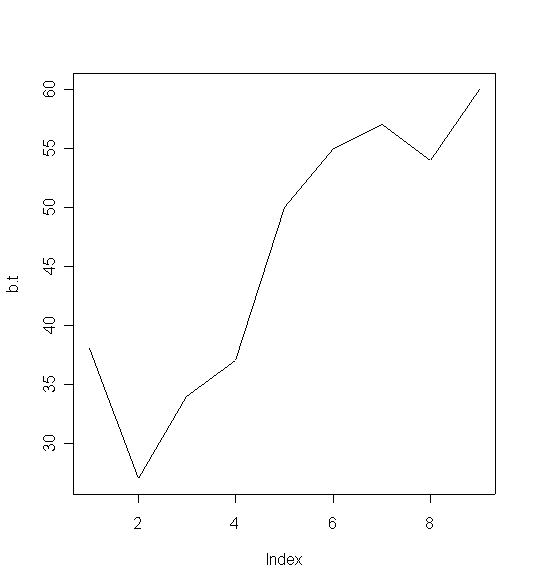
# Linie mit Symbolen
plot(b.t, type='b', axes=F)
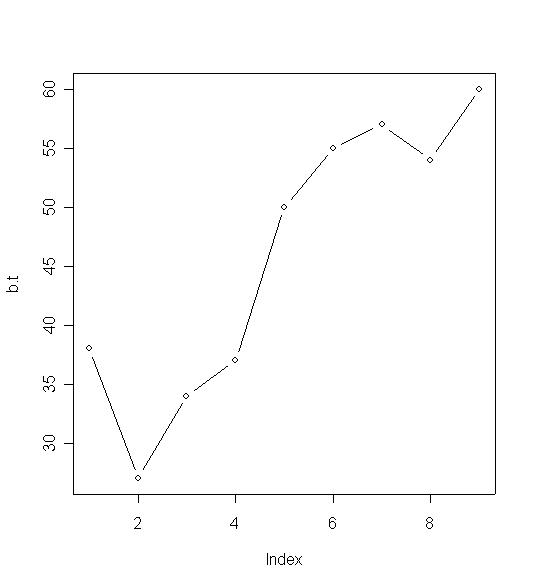
# Linie mit Symbolen, keine Default-Achsen (kommt als low-level-Befehl)
plot(b.t, type='b', axes=F)
# Default Y-Achse
axis(2)
# Anpassung der X-Achse (Ticks und deren Beschriftung)
axis(1, at=c(1,    4,5,6,7,8,9), labels = c('01',  '04', '05', '06', '07', '08', '09'))
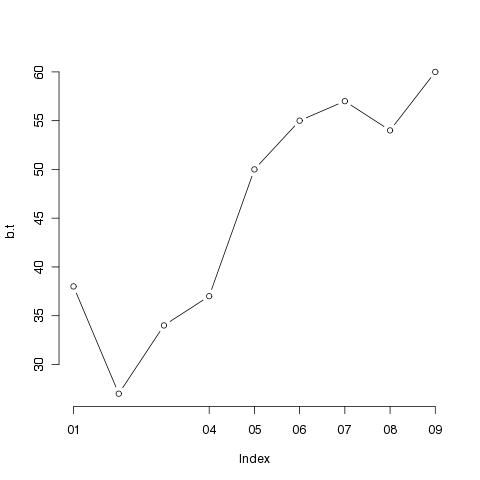
# Linie mit Platz für Symbole; cex: character expansion
plot(b.t, type='b', cex=0)
# und die Punkte dick hinterher
# lwd: line width
points(b.t, lwd=4, cex=3)
# dasselbe mit ausgefülltem Kreis
points(b.t, lwd=3, cex=3, pch=19)

# Multiple Linien, verschiedene Symbole
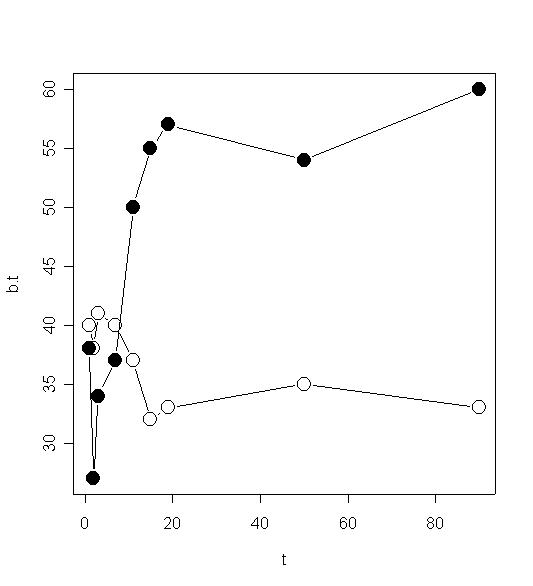
plot(cbind(t, b.t), type='b', pch=19, cex=2)
points(cbind(t, b.w), type='b', pch=21, cex=2)
# Anhübschen
plot(cbind(t, b.t), type='b', pch=19, cex=2,
  main='Grafiken in R - Grafiken wie bisher\nZufriedenheit mit den Ergebnissen',
  ylab='T-Werte 50 ± 10',
  sub='Messzeitpunkt (Wochen)'
)
legend(60, 50, c('Training','Control'), pch=c(19, 21))
points(cbind(t, b.w), type='b', pch=21, cex=2)

# Linien unterschiedlicher Länge
b.t <- c(38, 27, 34, 37, 50, 55, 57, 54, 60)
b.w <- c(40, 38, 41, 40, 37, 32, 33, 35, 33)
t   <- c( 1,  2,  3,  7, 11, 15, 19, 50, 90)

b.2 <- c(50, 45, 46, 39, 41)
t.2 <- c( 6, 10, 17, 19, 55)

plot(cbind(t, b.t), type='b', pch=19, cex=2)
points(cbind(t, b.w), type='b', pch=21, cex=2)

points(cbind(t.2, b.2), type='b', pch=22, cex=2)
# Zwei Linien mit Streuungsbalken
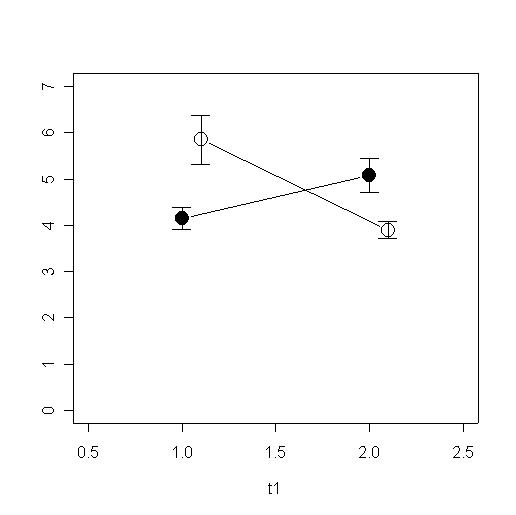
mw <- cbind(c(4.15,5.08),c(5.85,3.9))
se <- cbind(c(0.89 / sqrt(13), 1.32 / sqrt(13)),c(1.89 / sqrt(13),0.57 / sqrt(10)))
t1 <- c(1,   2)
t2 <- c(1.1, 2.1)
plot(cbind(t1, mw[,1]), type='b', pch=19, cex=2, ylim=c(0,7), xlim=c(0.5,2.5))
points(cbind(t2, mw[,2]), type='b', pch=21, cex=2)

arrows(t1[1],mw[1,1],t1[1],mw[1,1] + se[1,1], angle=90, length=0.1)
arrows(t1[1],mw[1,1],t1[1],mw[1,1] - se[1,1], angle=90, length=0.1)
arrows(t1[2],mw[2,1],t1[2],mw[2,1] + se[2,1], angle=90, length=0.1)
arrows(t1[2],mw[2,1],t1[2],mw[2,1] - se[2,1], angle=90, length=0.1)

arrows(t2[1],mw[1,2],t2[1],mw[1,2] + se[1,2], angle=90, length=0.1)
arrows(t2[1],mw[1,2],t2[1],mw[1,2] - se[1,2], angle=90, length=0.1)
arrows(t2[2],mw[2,2],t2[2],mw[2,2] + se[2,2], angle=90, length=0.1)
arrows(t2[2],mw[2,2],t2[2],mw[2,2] - se[2,2], angle=90, length=0.1)
Alternativ und mit weniger Aufwand: Benutzen des Paketes psych
library(psych)
dd <- read.delim("http://www.psych.uni-goettingen.de/de/mat/mv/virtual-motoric.txt")
dd[1:5,]
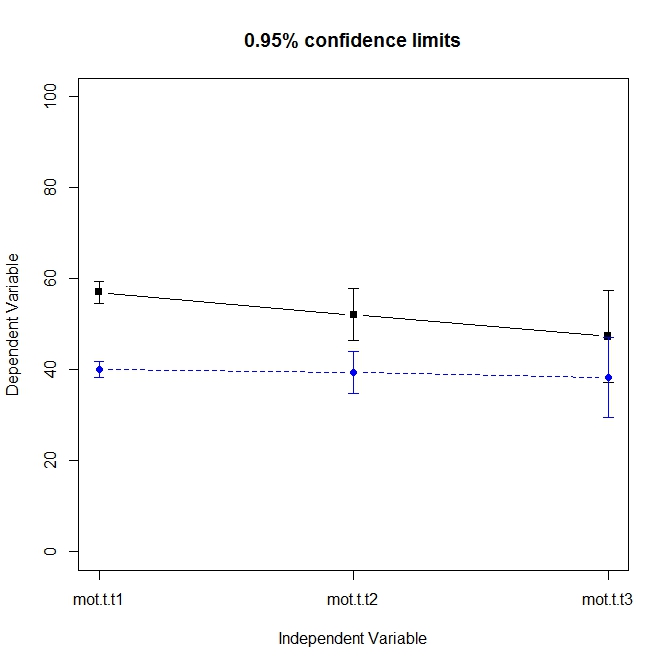
# error.bars.by library(psych)
error.bars.by(dd[,3:5], dd[,2] < 50, ylim=c(0, 100))
